Características destacadas
- Easy to use USB interface to analysis PC
- Plug in screw-terminal makes it easy to interface with CC-Link network
- Get instant network status overview with graphical Dashboard
- Instantly identify faulty nodes and cause of fault (Disconnected nodes, Watch Dog Timer Errors and System Faults)
- Drill down the problem using the detailed protocol decodes in Frame Display
- Use same software for both CC-Link serial and CC-Link IE analysis
- Share captured data among team mates using the Free capture file viewer software
Descripción
The NetDecoder – CC-Link Analyzer is a comprehensive data capture, debugging, network monitoring and analysis tool for troubleshooting CC-Link networks. The NetDecoder software works with Frontline’s CC-Link ComProbe to capture CC-Link serial data. The CC-Link ComProbe connects to the analysis PC via USB 2.0 port. The analyzer software includes detailed decoder information for CC-Link frames, network statistics and a graphical Dashboard showing node status and an error log. To capture CC-Link IE data, customers can use the PC’s NIC card or Frontline’s Ethernet ComProbe network tap. The NetDecoder software’s Ethernet Network View and Ethernet Dashboard view provide graphical analysis for CC-Link IE.
Benefits
- Easy to use USB interface to analysis PC
- Plug in screw-terminal makes it easy to interface with CC-Link network
- Get instant network status overview with graphical Dashboard
- Instantly identify faulty nodes and cause of fault (Disconnected nodes, Watch Dog Timer Errors and System Faults)
- Drill down the problem using the detailed protocol decodes in Frame Display
- Use same software for both CC-Link serial and CC-Link IE analysis
- Share captured data among team mates using the Free capture file viewer software
Features
- The CC-Link ComProbe connects to the analysis PC via USB 2.0 port.
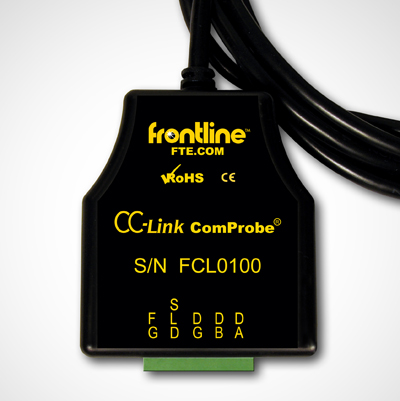
- The CC-Link ComProbe has screw-terminal connectors to plug in to the CC-Link network.
- The screw-terminal connector has pins for CC-Link data lines (DA, DB, DG) and system ground (SD (shield) and FG (field ground)).
- The CC-Link ComProbe supports all CC-Link data rates (156 Kbps, 625 Kbps, 2.5 Mbps, 5 Mbps and 10 Mbps).
- The decoders will decode both CC-Link specification version 1 and version 2 frames.
- The CC-Link Dashboard shows an Active Device Grid and an Error Log.
- The NetDecoder analyzer also provides decoders for CC-Link IE (CC-Link over Industrial Ethernet). It supports both IE-Field and IE-Control protocols.
System Requirements
- Intel Core Duo 1.2 GHz or higher.
- Windows XP SP3 (32-bit), Windows 7 (32-bit or 64-bit)
- RAM: 1 GB minimum, 2 GB recommended
- One USB 2.0 Port
Dashboard
The CC-Link Dashboard Dialog contains two main features:
- An Active Device Grid
- An Error Log
The device grid shows all 64 nodes on a CC-Link network with each node represented by a numbered square on the grid. The squares are color coded to indicate the state of the node.
- Grey: Node Not Present on the network
- Green: A Connected Node operating normally without errors
- Light Green: An Occupied Station within a Previous Node.
- Red: Disconnected Node
- Orange: Node with a Watch Dog Timer Error
- Yellow: Node with a System Fault
- Blue: Node operating correctly but had a previous error
Nodes Not Present on the Network: Nodes that are not present on the network are grayed out in the device grid.
Connected Nodes: All nodes operating without errors are marked in green.
Occupied Station within a Previous Node: CC-Link supports the concept of Occupied Stations, in which a single node on the network can be configured to have multiple stations. For example, if node 3 is configured to have two occupied stations, then node 3 is shown in green and node 4 is shown in light green. This information is also conveyed in Frame Display.
Disconnected Node: If a node that is working properly gets disconnected for any reason, then the Dashboard shows the node marked in red and the Error log shows the exact Frame number at which the Master is retrying to poll the node. The Error log shows the Frame number, the node and the error event that happened on that frame.
Node with a Watch Dog Timer Error: When a Slave node responds to a Master’s Poll request, the response frame contains a Station Information (ST1) byte. The first bit of the ST1 byte indicates a Watchdog Timer error. If a node sends a frame with this bit set, then the node is marked in orange and error is logged in the error list.
Node with System Fault: When a Slave node responds to a Master’s Poll request, the response frame contains a Station Information (ST1) byte. Apart from the Watchdog Timer bit and the Cyclic Transmission flag, this field contains 5 bits that provide information on the node’s status. These fields include:
- Switch Change Detection
- Parameter Receive
- Refresh Receive
- Unit Error/Invalid Number of Points
- Fuse Status
If any of these 5 flag bits are enabled, then the node is flagged as having a System Fault. To dig deeper into this System Fault, users can see the actual frames in Frame Display.
Node with a Previous Error: Sometime a node can have an error and then recover after a while. In such cases, the correctly operating node is first displayed in Green. When it has a System Fault, it goes to Yellow state. When the node recovers, it goes to Blue state.
The Error log shows a list of all errors along with the Node that caused the error and the frame number in which the error was found. The errors listed in the ‘Events’ column include Watch Dog Timer errors, Disconnected error, Switch Change Detection error, Parameter Receive error, Refresh Receive error, Unit Errors and Fuse Status error. A single frame can have multiple errors. In such cases, all the events are concatenated into a single string separated by semi-colons.