Características destacadas
- special capture filters AND
- a comprehensive DH+ network statistical analysis module.
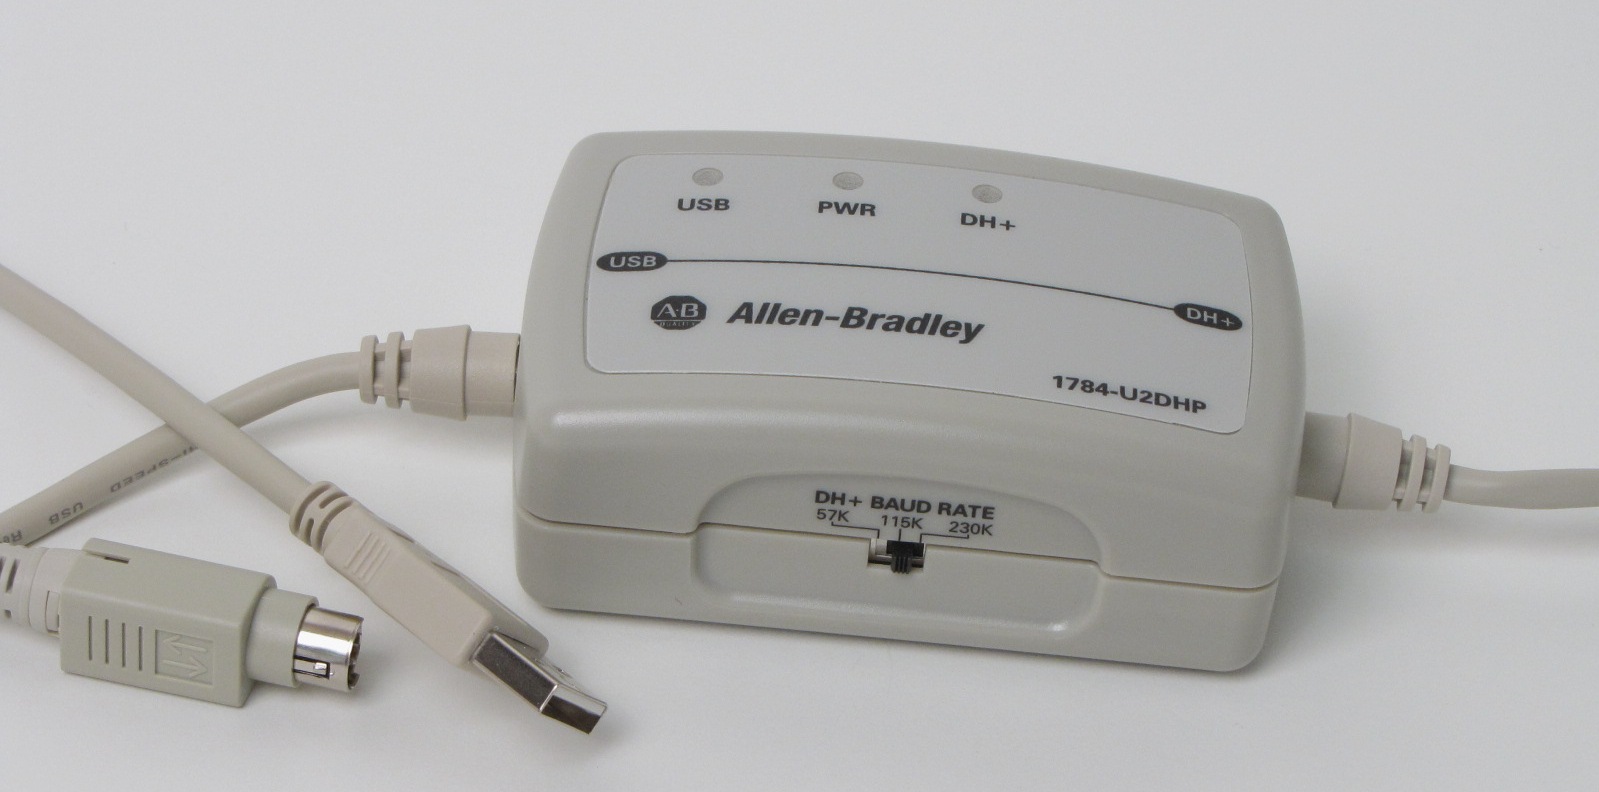
- The 1784-U2DHP provides easy connectivity to analysis PC via USB. You do not need to use any special serial drivers on your analysis PC.
- The 1784-U2DHP provides easy connectivity to the DH+ network using the 8-pin DIN connector. There is no need to re-wire your DH+ network to connect the analyzer.
- The 1784-U2DHP supports special capture filters that make it easier to drill down to the specific problem on the network.
Descripción
NetDecoder - DH+ Analyzer:
Sniff, Analyze, Debug and Troubleshoot Data Highway Plus networks
The NetDecoder - DH+ Analyzer is a comprehensive data capture, debugging, network monitoring and analysis tool for troubleshooting DH+ networks.
The NetDecoder analyzer works with Rockwell Automation’s 1784-U2DHP to capture DH+ data.
Note: You must have firmware version 1.7 or higher on your 1784-U2DHP to use it with the NetDecoder software. You can find more information about the latest firmware
for your 1784-U2DHP from Rockwell Automation’s website:
USB-to-Data Highway Plus Cable (1784-U2DHP)
For more setup information using the 1784-U2DHP with the NetDecoder software, please refer to our Quick Start Guide.
Note: The NetDecoder software also supports the DL-3500 with custom firmware to sniff DH+ traffic. However, Frontline no longer sells the DL-3500. All new customers who wish to capture and analyze DH+ network traffic are encouraged to use Rockwell Automation’s 1784-U2DHP USB-to-Data Highway Plus Cable.
Benefits
- The 1784-U2DHP provides easy connectivity to analysis PC via USB. You do not need to use any special serial drivers on your analysis PC.
- The 1784-U2DHP provides easy connectivity to the DH+ network using the 8-pin DIN connector. There is no need to re-wire your DH+ network to connect the analyzer.
- The 1784-U2DHP supports special capture filters that make it easier to drill down to the specific problem on the network.
Features
Along with the many standard protocol analysis features, the NetDecoder analyzer with the 1784-U2DHP also provides
- special capture filters AND
- a comprehensive DH+ network statistical analysis module.
These combined make NetDecoder an easy-to-use DH+ network monitoring and troubleshooting tool.
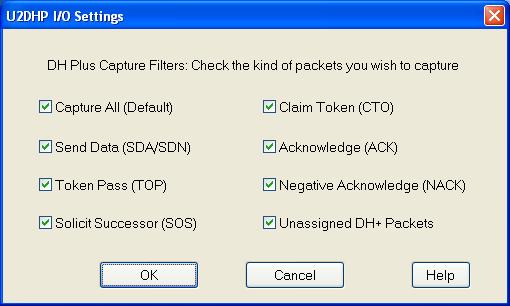
Capture Filters using the 1784-U2DHP
The DH Plus analyzer, using the 1784-U2DHP, allows users to select the type of packets to be captured. This type of filtering eliminates capturing unnecessary frames and allows the user to quickly pin-point the source of the network problem. You select which frames to capture using the I/O settings dialog.
Capture Filters
You access the I/O Settings dialog by selecting IO Settings from the Options menu on the NetDecoder Control window.
- Select the kind of DH+ frames you need to capture by clicking the appropriate check boxes.
- If more than one box is checked, then the selection is treated as a logical AND condition.
- The default setting is to capture all traffic.
- If none of the items are checked on the dialog, the program defaults to a ‘capture-all’ state.
- Select OK to accept the values and close the dialog or Cancel to disregard the settings and close the dialog.
The users have the option on setting capture filters based on the DH+ frame type. The supported frame types include:
| 1. Send Data (SDA/SDN) |
5. Acknowledge (ACK) |
| 2. Token Pass (TOP) |
6. Negative Acknowledge (NACK) |
| 3. Solicit Successor (SOS) |
7. Unassigned DH+ Packets |
| 4. Claim Token (CTO) |
|
DH+ Statistics Module
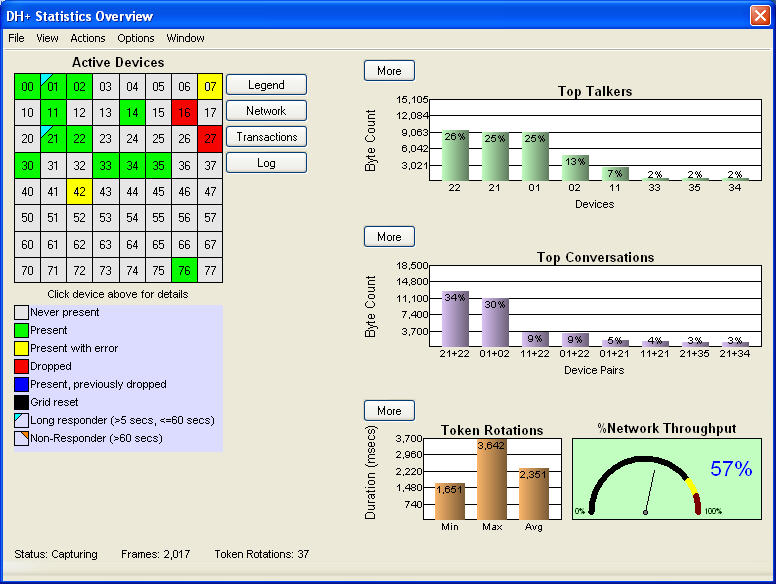
The NetDecoder DH+ Analyzer includes a DH+ statistical analysis module that provides critical network statistics in a graphical, easy-to-comprehend manner that makes debugging network problems easy. The statistical module is helpful when starting up, surveying, benchmarking and troubleshooting DH+ networks. The DH+ statistical module is also designed to be a continuous monitoring feature that makes it easy to spot network problems in their nascent stage. Early detecting and intervention will prevent small problems from escalating into huge network downtimes.
Data Highway Plus (DH+) is an Allen Bradley, Rockwell Automation, token passing data communications network. This protocol consists mainly of Tokens, Solicits, ACKs, NAKs, Timeouts and Data messages. The device IDs are octal numbers running from a value of 000 to 077 octal. Tokens are passed in an orderly fashion from lowest ID to highest ID with the potential for a single Solicit per complete Token Rotation in order to pick up any additional devices on the network. Once a token is received, the receiving device can place Data Messages on the network (usually up to 4 at a time), wait for Acknowledgements or Timeouts, send a Solicit to the next device on the solicit list or pass the Token to the next Token Successor.
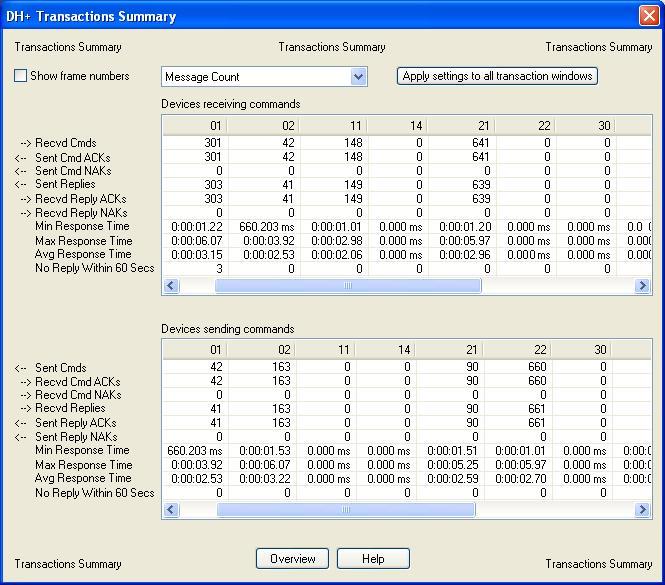
Transactions Summary
The DH+ statistics overview screen provides a quick and easy to understand analysis of your overall network performance. The additional screens are used in order to drill down deeper into the individual device and conversation statistics. These screens can be captured for use in reports by pressing the ALT and PRINT SCREEN keys and pasting them into your reports. The information provided in the statistical analysis module can be used to survey and benchmark existing networks, assist in the commissioning of new networks or network expansions, and diagnose intermittent device communications. All of this information can also be exported to a ".csv" file for further analysis or custom report writing from the File Menu. The statistical analysis module can be run or rerun on any previously captured DH+ network files. Keep in mind that if a capture file is set to wrap, the original statistics are calculated over the entire capture session as opposed to merely representing what has been captured to disk. If you recreate the statistics from the File Menu, your original session statistics will be overwritten to reflect only the data captured to the disk file. Statistics files are named using the same name as your capture file and a file extension of ".sts". It is possible to save both session and capture file statistics by saving the capture file to another name and then recreating the statistics from the File Menu.
Event Log
Individual device statistics can be obtained by clicking on the device number box in the grid, for the device of interest. This display will detail all traffic to or from the device in question. Notice that the display breaks the various conversations down into their individual components; Commands, Replies, Acknowledgements, and Negative Acknowledgements. The top-most table displays all of the communications statistics for traffic that has originated from the device of interest. Conversely, the bottom most table displays all of the communications statistics for traffic that has taken place with this device but was originated by other devices. Notice that response times are displayed here as well. These can be used to determine worst case device performance. Note that in general, the number of Commands, ACKs and Replies should be equal on a well-behaved network. Due to the timing of the capture being started and stopped, single digit number differences may occur but any differences of 10 or more indicate a loss of communications between the devices in question. It is also likely that one of the two devices in question will have either a yellow, red, or blue box on the grid or a red triangle in the upper right corner of their box indicating a problem with that device.
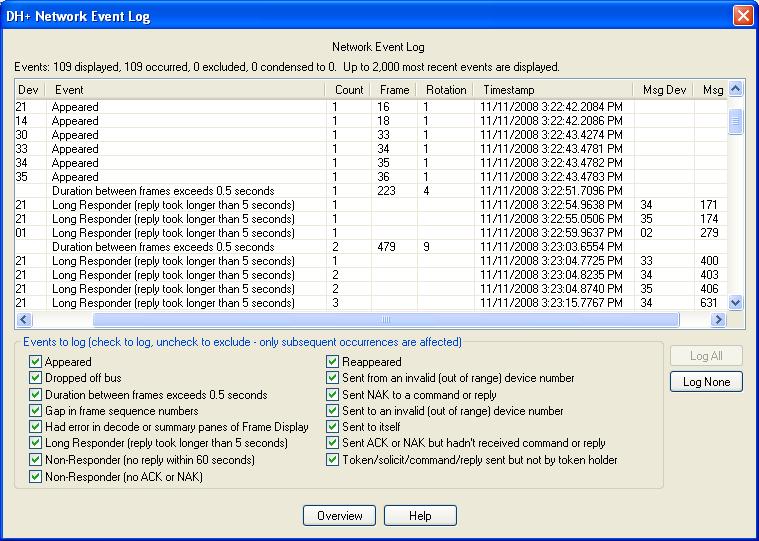
Clicking on the Log button or selecting View, Network Event Log from the DH+ Statistics Overview Screen will show a dialog with a breakdown of various network events that are automatically logged. This information provides additional details about the health of your network. This log stores the most recent 2000 events and can be easily overrun by devices being powered down if the logic is not written to consider this fact. Large percentages of network bandwidth can be absorbed by messages and retries directed at devices that are no longer on the network. The non‐responder and long responder markings on the device grid and the network event log will help to identify this kind of inefficiency. You will notice that in the example below, Device 021 appeared on the network and then took more than 5 seconds, but less than 60 to respond to commands sent to it. An indication that this has occurred is readily available on the Active Devices Grid, by way of the blue triangle in the device ID box for device 021. This could be an indication that Device 21 is overloaded or is starting to fail. The Network Event Log provides supplemental information regarding how often a particular device is not responding or is a long responder.