Características destacadas
- Ethernet Dashboard View
- Ethernet Network View
- Frame Display View
- TCP, Ethernet, UDP, IPv4, IPv6, ARP, DNS, DHCP/BOOTP, HTTP, ICMP, IGMP, LLC 802.2, LLDP, IBM NetBIOS, NBDS, NBNS, NBSS, NCP, RARP, SMB, SMTP, Novell Netware (IPX, SPX, IPX NetBIOS, NPX ROP, IPX SAP, NCP), and ISO CLNP.
Descripción
Ethertest: The Ethernet Communications Analyzer and Monitor Includes a Graphical Network View and Dashboard Views
Troubleshoot Communications – Quickly Reduce Downtime and Increase Production.
Ethertest is a general purpose Ethernet communications monitor and
protocol analyzer for 10Mbps, 100Mbps and 1Gbps Ethernet local area
networks. Performs full 7 layer decodes on TCP/IP, SMB, NetBIOS, Novell
NetWare, and more. Interfaces with the LAN through a PCs standard
network Interface Card (NIC). In applications ranging from financial
institutions to manufacturing facilities, network engineers will find
Ethertest easy to work with but loaded with features.
High level views of your network activity can provide you a quick
understanding of your network's performance and health.
Monitor the Traffic:
Monitoring and Visibility of Key Network Parameters is the
Secret to Understanding How Loaded and Stable Your Network
is.
Understand the Traffic: See Who's Talking to Who and Individual Node
Statistics
See the Details with Frame Analysis
View data at varying levels of granularity, from the
frame/message level to bit/byte level.
Ethertest is a passive and easy-to-use network monitor that helps
network personnel understand what is occurring on their communications
LANs. The Dashboard View, Network View and Frame Display are intuitive,
easy to read, and quickly provide a wealth of information about the
network. Although Ethertest is simple to work with, it does provide a
level of sophisticated and detailed information demanded by today's
network specialist.
Ethernet Decoders
- TCP, Ethernet, UDP, IPv4, IPv6, ARP, DNS, DHCP/BOOTP, HTTP, ICMP,
IGMP, LLC 802.2, LLDP, IBM NetBIOS, NBDS, NBNS, NBSS, NCP, RARP, SMB,
SMTP, Novell Netware (IPX, SPX, IPX NetBIOS, NPX ROP, IPX SAP, NCP),
and ISO CLNP.
This is the
Ethernet Dashboard
Display Window
for
TCP, Ethernet, UDP, IPv4, IPv6, ARP, DNS, DHCP/BOOTP, HTTP, ICMP,
IGMP, LLC 802.2, LLDP, IBM NetBIOS, NBDS, NBNS, NBSS, NCP, RARP, SMB,
SMTP, Novell Netware (IPX, SPX, IPX NetBIOS, NPX ROP, IPX SAP, NCP), and
ISO CLNP.
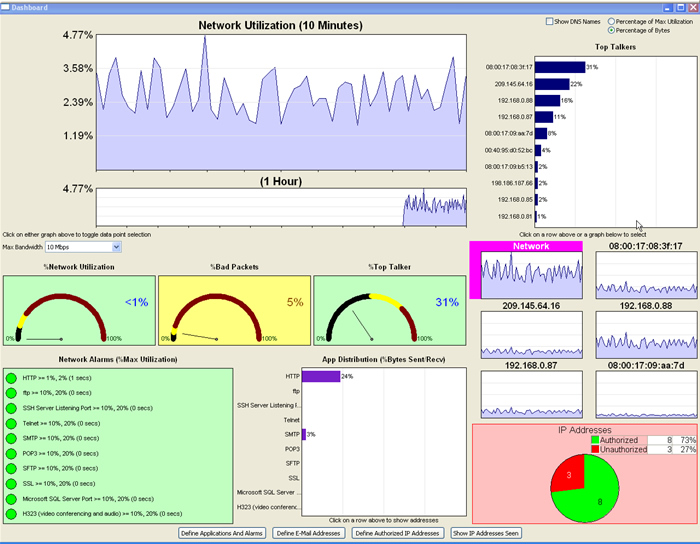
The Ethernet
Dashboard includes: Top Talkers, 10 minute Histogram for Network
Utilization, Histogram on Top Talkers, Alarms and protocol activities
and more.
Ethertest's new Dashboard View enables you to see the dynamics
of what is occurring on your Ethernet communications network. See an
overview of the top talkers, protocol statistics, network utilization along
with network alarms for the section of the network you are monitoring.
Ethertest is a passive monitor and does not contribute to network loading.
Dashboard Activity View
- Network Utilization Meter with Background Color Alert.
- 10 Minute Histogram of Network Utilization.
- Graphic Specific Activity can be Tied Back to Packet Decode Details.
- Network Meter for Bad Packets with Background Color Alert.
- Top Talker Meter with Background Color Alert.
- Top Ten IP/MAC Addresses Contributing to Network Traffic.
- 10 Minute Histogram of Top Ten IP/MAC Address Activity.
- Distribution of TCP/or UDP Application Related Communications
Protocols.
- Network Alarms for Unauthorized IP Addresses.
- Network Alarms for User Define Protocol Alarm Levels.
- Email Notification Option for Alarms.
- Display Options for 10MB, 100MB and 1GB Network Speed.
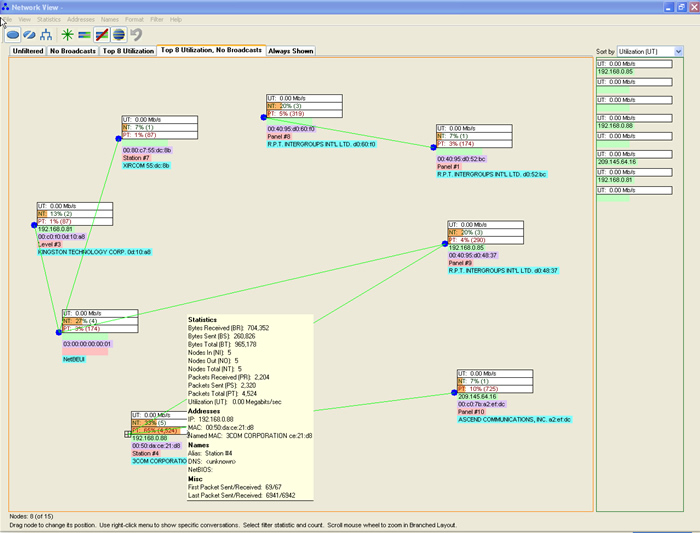
Ethertest’s new
Network View
enables you to see statistics on
specific nodes including communications traffic details and node
information for active nodes on the monitored side of the
switch.
Ethertest's Network View enables you to see the dynamics
of what is occurring on your Ethernet communications network. See an
overview of the node activity and who is talking for the section of
the network you are monitoring. Ethertest is a passive monitor and
does not contribute to network loading.
Network View Feature Includes:
- Packets Transmitted and Received
- Bytes Transmitted and Received
- DNS Names
- Nodes In and Out
- Utilization Information
- Broadcast Information
- IP Address and MAC Address
- Named MAC Address
- NetBios Name
- Assigned User Friendly Names for each Node
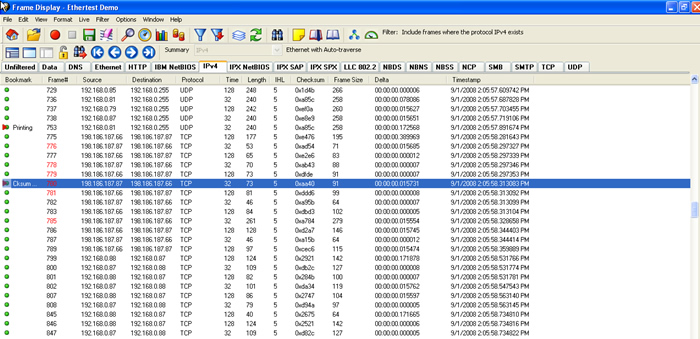
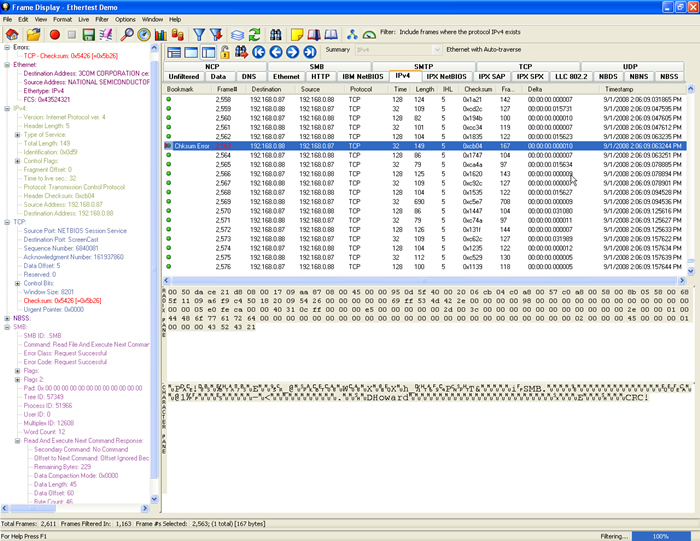
Frame Display Window
-
Frame Analysis
View data at varying levels of granularity, from
frame/message
level to bit/byte level.
Includes summary information for
messages sent and received.
Decoding of message into text.
Protocol errors are identified with red frame numbers. Message is
shown in
binary,
octal,
hex and
ASCII.
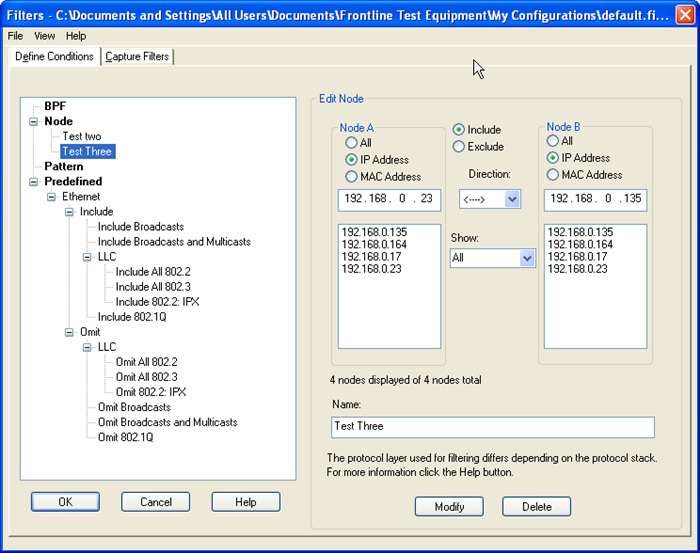
Display filters include pre-set filters, node information filters
and user defined complex filters.
Capture filter limits the
amount of Ethernet data captured.
Multiple Frame Display Windows
can be opened for simultaneous views of different sections of the
captured data.
Pane
Summary
- Frame Summary
View a one line
high-level overview of each data frame/message. Select a
protocol layer and the most significant fields are displayed in a
concise form. Selecting a specific message frame causes
text
information to appear in the Frame Decode pane. To facilitate
troubleshooting, all panes are adjustable in size and are
synchronized. Selecting a message frame in the Summary pane
automatically updates the other panes.
Selecting an item in
the Decode pane highlights the corresponding bits or bytes in the other
panes.
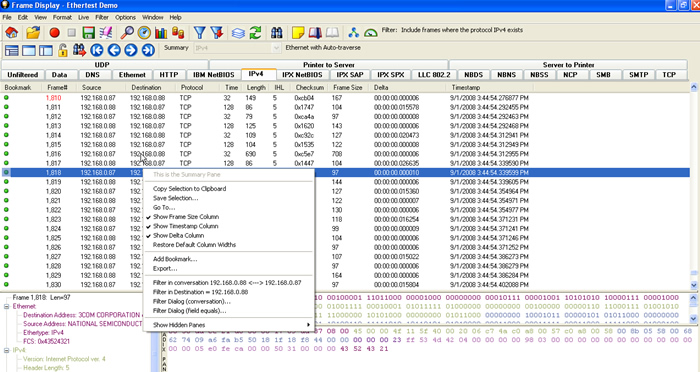
Protocol errors result in red frame numbers. Quick-filters
create a new Summary display that only includes frames/messages that
contain the protocol layer you have selected, making it easy to zoom in
on your messaging/protocol problems. Frame Summary information can be
exported into CSV format and loaded into a spreadsheet or other
program to do intricate statistical analysis of protocol and network
information.
Frame Decode
View a comprehensive layered decode of each frame/packet through the
Decode Pane
Each field of a data frame is decoded layer-by-layer using a tree
structure, with clear, concise descriptions. Selecting a field will
automatically highlight the associated bytes in binary, hex, and ASCII.
Selecting an item in the Decode pane will also highlight corresponding
bits/bytes in other panes. Use the Summary pane to identify protocol or
messaging problems and then drill-down using the Decode pane to solve
the problem.
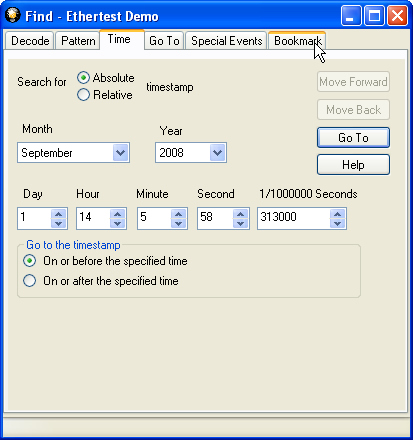
Frame
Display - Frame
Level Search
Examine and search data as it is being captured (or after it has been saved), through use
of the
Find Function
Use the Find Function to quickly pinpoint problem areas in the captured
data or to move to a specific frame. The frame level Find Function can 1) search the text
of the decode for a specified string, 2) search for errors, and 3) limit the search to
specific node. Data searches can also be performed at the byte level.
Frame Display - Has Easy to Use
Capture and Display Filters to Enable You to View the Parameters You
Need to See Fast
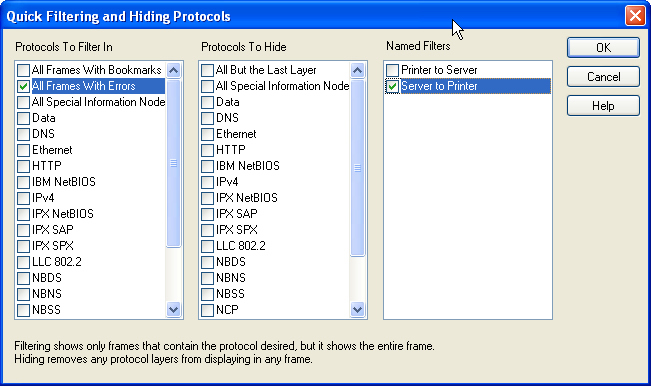
- Tab Filters - Display only selected protocol.
- Quick Display Filters - Preset Filters for displaying
error messages, bookmarks, protocols and more.
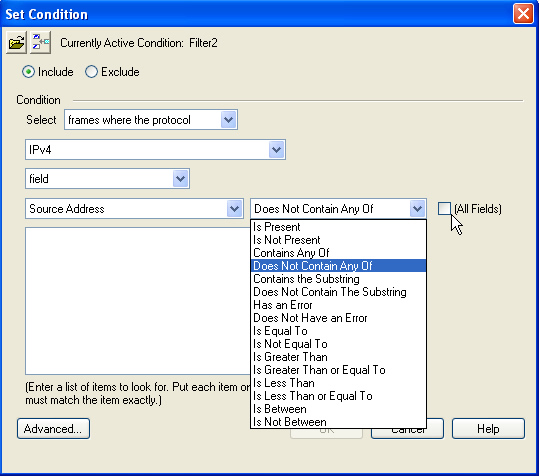
- Right Click Display Filters - Place cursor over the
parameter you want to filter on and right click to setup the user
defined filter for that parameter.
- User Defined Display Filters - with User defined filter
the user can design display filters for their specific requirements.
Frame Display - Capture and Display Filters
Use a Capture Filter to capture only the specific IP or MAC
address information that you are interested in. Sift through large
volumes of captured data and focus only on the problem areas.
FTS's unique "drill down" capability enables the user to apply
new
filters
while preserving previous views of the data. Captured data can be
filtered on either an "include filtered data" or "exclude filtered data"
basis. Filter parameters include protocol and data pattern; advanced
mode enables the user to set up complex filters.
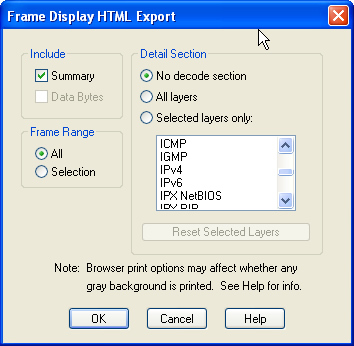
Frame Display - Frame Export
Outputs
frame level information in text. Provides output that is
formatted and human readable, suitable for importing into a
spreadsheet or database, or useable by other programs for
post-processing.
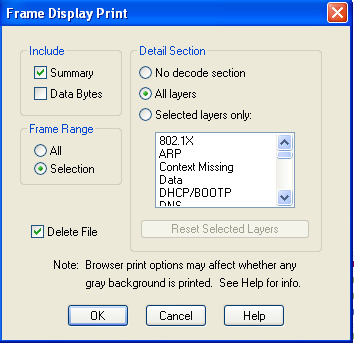
Frame Display - Print Function
The Print Function allows the user to select the specific Frame Display
areas to print.
Ethernet ComProbe®: Frontline's portable, non-intrusive, aggregator Ethernet Tap
- The Ethernet ComProbe captures bi-directional Ethernet data.
- The Ethernet ComProbe and the analysis PC to which it is connected are invisible to the network.
- The tap does not interfere with auto negotiation/speed or duplex settings.
- The "Permanent Network Link" feature guarantees permanent network connectivity.
- There is no packet loss even if the USB power fails or the USB port is disconnected.
- The tap is compatible with NetDecoder and Ethertest software protocol analyzers.
- The tap is also compatible with the free, open-source Wireshark protocol analyzer
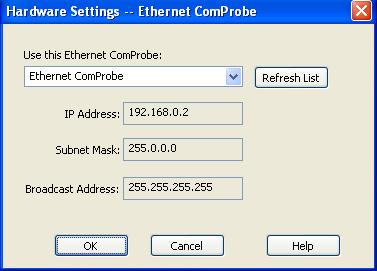
Hardware Settings Information
The Hardware Settings dialog allows you to select a specific Ethernet ComProbe device to sniff your Ethernet traffic.
You access the Hardware Settings dialog by selecting Hardware Settings from the Options menu on the NetDecoder Control Window. Select a device from the drop-down list. The NetDecoder analyzer automatically scans and identifies all the Ethernet ComProbe devices plugged into the PC. The IP address, subnet Mask and the Broadcast Address for that particular device are displayed. These are display only and cannot be edited.
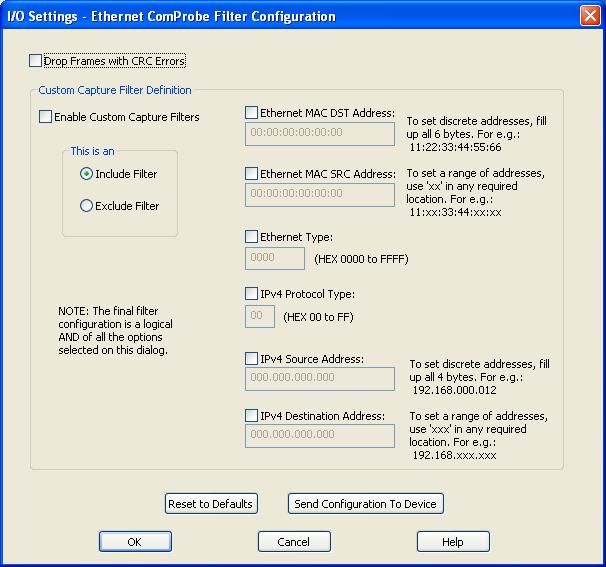
Capture Filter Settings
The I/O Settings dialog allows you to configure the Ethernet ComProbe with special capture filters.
You access the I/O Settings dialog by selecting I/O Settings from the Options menu on the NetDecoder Control window. There are a number of settings you can select on this dialog that will affect how the frames are captured and displayed.
At the top of the dialog is one check box:
Remove CRC32 Bytes: When this option is enabled (checked), the Ethernet ComProbe removes the 4-bytes of CRC data from every Ethernet frame before passing it up to the software.
The dialog also allows users to define custom capture filters.
Enable Custom Capture Filter: Selecting this check box either enables or disables the capture filters.
This is an:
Include Filter: When you select this radio button, the Ethernet packets that match the filter settings are captured and displayed.
Exclude Filter: When you select this radio button, the Ethernet packets that match the filter settings are discarded. Only packets that do not match the settings are captured and displayed.
On the right side are six text entry boxes and their corresponding Check Boxes: If any of the Check boxes are unselected, then the corresponding text entry boxes are also disabled.
Ethernet MAC DST Address: Enter the Ethernet MAC Destination Address
Ethernet MAC SRC Address: Enter the Ethernet MAC Source Address
- To set discrete MAC addresses, fill up all 6 bytes. For e.g.: 11:22:33:44:55:66.
- To set a range of MAC addresses, use 'xx' in any required location. For e.g.: 11:xx:33:44:xx:xx.
Ethernet Type: Enter the 2-byte Ethernet Type value in hex. The value can range from 0x0000 to 0xFFFF.
IPv4 Protocol: Enter the one byte IPv4 protocol type. The value can range from 0x00 to 0xFF.
For a complete listing of the Ethernet Types and the IPv4 Protocol types, visit The Internet Assigned Numbers Authority (IANA) website (www.iana.org). Here are some common types and their values:
IPv4 Source Address: Enter the Source IP Address
IPv4 Destination Address: Enter the Destination IP Address
- To set discrete IP addresses, fill up all 4 bytes. For e.g.: 192.168.000.012.
- To set a range of IP addresses, use 'xxx' in any required location. For e.g.: 192.168.xxx.xxx.
- The address must be of the form 'AAA.BBB.CCC.DDD'. e.g. 192.168.112.135.
- None of the individual numbers should be greater than 255.
- For numbers less than 100, use preceding zeroes e.g. '027'. e.g. 192.168.001.028
- Use 'xxx' to denote a range of address in of the 4 sub-fields. e.g. 192.168.xxx.xxx.
After selecting/entering values, it's very important that you understand what the buttons at the bottom of the dialog do when you select them.
Reset to Defaults: When you select Reset to Defaults all options are disabled.
Send Configuration to Device: After setting all the options in the dialog, you must click on ‘Send Configuration to Device’ before ‘OK’ to transfer the settings to the Ethernet ComProbe.
OK: There are two things to consider with the OK button.
- If you click OK before you select Send Configuration to Device, the dialog will close and the settings will be saved, but they will not be transferred to the ComProbe. The settings will, however, be there if you open the dialog again.
- If you select OK after you select Send Configuration to Device, the dialog will close, the settings will be saved and transferred to the ComProbe.
Selecting Cancel overrides all the selections and returns the user to the Control Window.